The object of this experiment is to design, assemble, evaluate, and simulate an intermodulation distortion analyzer that can be used to evaluate the IM distortion performance of an audio amplifier.
For all of the circuits, you should have 100 μF decoupling capacitors from each power supply rail to circuit ground. You should be aware that these capacitors are polar electrolytics which can explode if they are put in with the wrong polarity.
Op amps can oscillate when equipment such as an oscilloscope is connected to a circuit. This is caused by the shunt capacitance of the connecting leads and the input capacitance of the test equipment. To minimize these problems, clip a 100 Ω resistor in series with the signal lead to the oscilloscope. Use the other end of the resistor to connect to the proto board.
You should never turn on a circuit without the oscilloscope connected to its output. Not doing this is like driving on a highway blindfolded. Connect the oscilloscope and adjust it so that it displays a trace before applying power to any circuit. Observe the scope to verify that the circuit is operating before taking any measurements.
Here is a short description of how an intermodulation distortion analyzer works. A classic intermodulation distortion analyzer is one that was made by Crown International. Here are two pages from the instruction manual that show the block diagram of the Crown IMA and some of the waveforms: page one and page two.
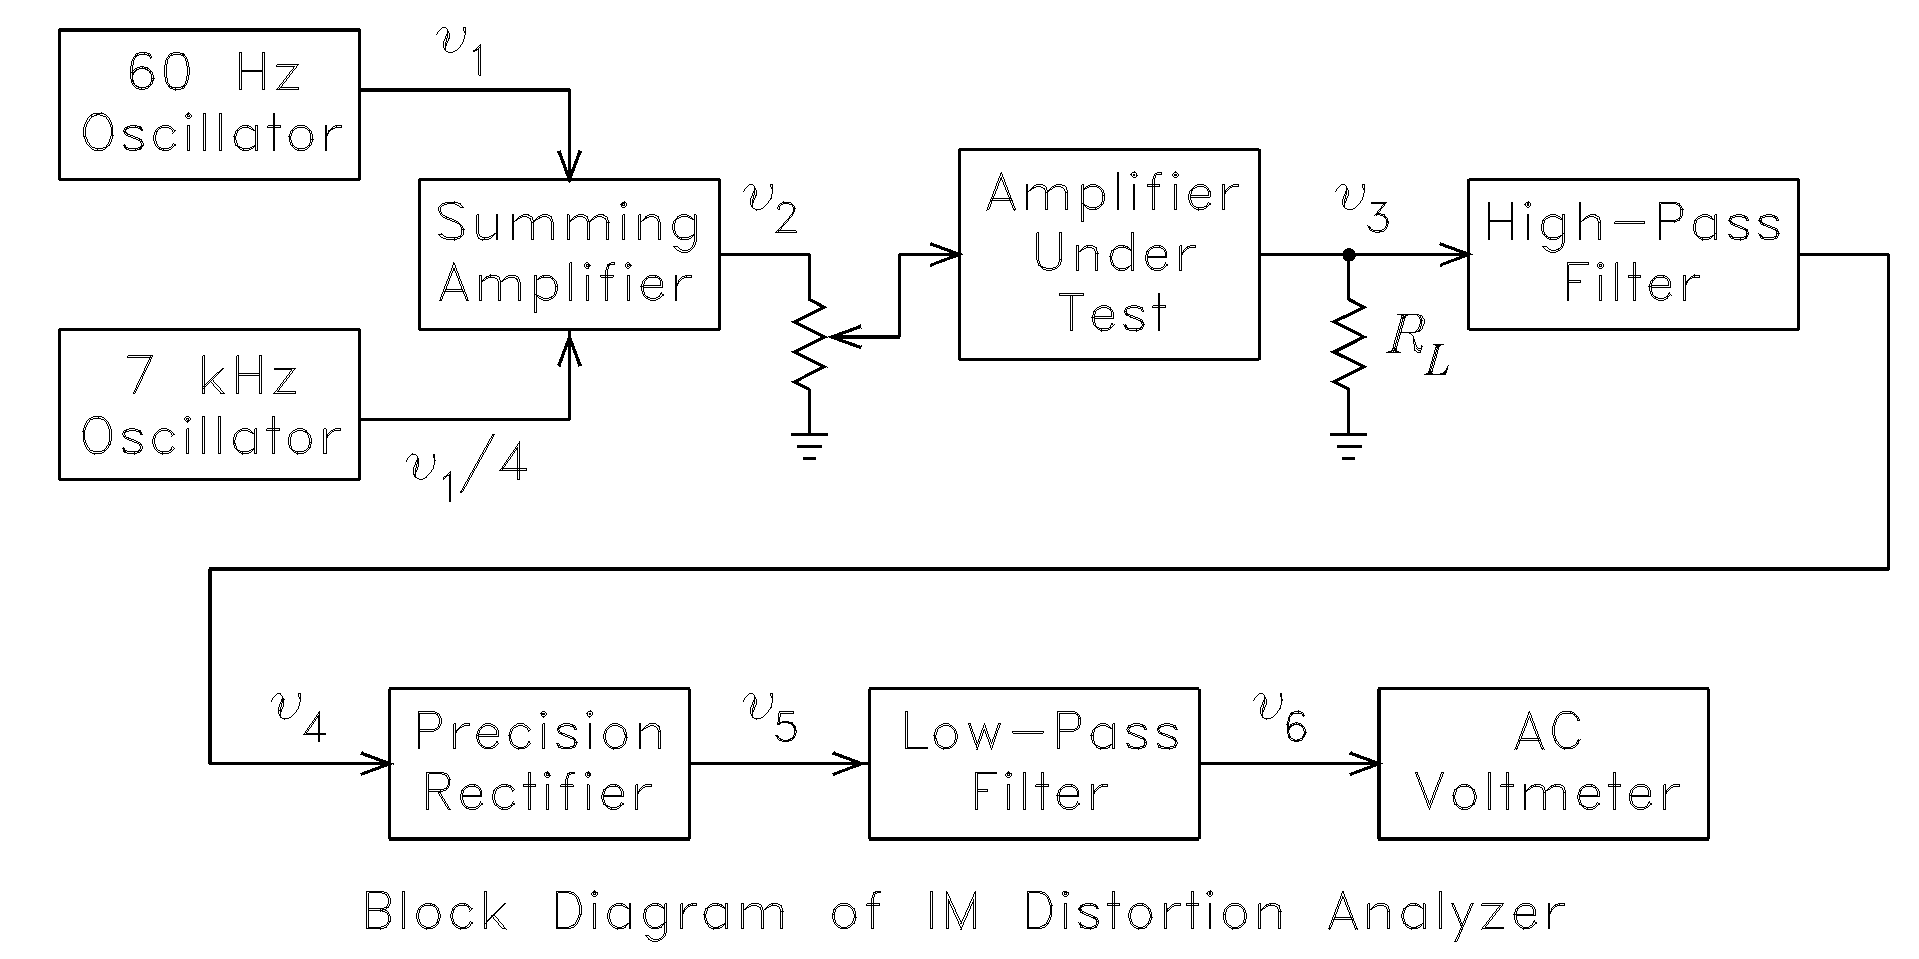
A possible block diagram of the analyzer is shown in the figure below. The audio amplifier is the one to be evaluated. You do not need to design it for this project. I will give the circuit to you later. Temporarily replace the amplifier block with a wire.
There are 2 oscillators, one operating at 60 Hz and the other at 7 kHz. You may take the oscillator circuit you have already designed in lab and change the resistors and capacitors in the RC feedback network to change the frequency. The frequency is proportional to (RC)-1. You can use ratios to calculate the new value of the time constants to change the frequency to the desired value. I recommend the oscillator with the simple diode stabilization network shown in Figure 10.2(a) of the text.
The outputs of the oscillators are applied to a summing amplifier. I would use the inverting summing amplifier. The two signals are to be summed such that the 7 kHz wave is 1/4 the amplitude of the 60 Hz wave. The output of the summing amplifier should have a peak voltage of about 4 V. This should be adequate for testing of most audio power amplifiers. The amplitude of the output voltage is to be adjustable with a potentiomenter. This can be connected as a voltage divider as shown in the figure or it may be part of the feedback network of the summing amplifier.
The output signal from the audio amplifier is to be applied to a high-pass filter that strips off the 7 kHz component of the signal. There should be a gain control in front of the high-pass filter, but this can be added later. I would recommend using a 3rd-order Chebyschev high-pass filter such as the one discribed in the Active Filter Potpourri. The cutoff frequency of the filter should be lower than 7 kHz. You might try 1 kHz and change it later if necessary.
The basic precision rectifier that should be used for the analyzer is shown in Fig. 9.30 of the Franco text. Resistor R3 determines the gain A of the circuit. I would choose A = 1 and change it later if more gain is required. There is no need to add a low-pass filter as shown in the block diagram above, for it can be realized simply by putting a capacitor in parallel with R3 in the rectifier circuit. The cutoff frequency of the filter is (2πR3C)-1. This frequency has to be greater than 60 Hz to pass the IM distortion waveform but low enough to filter out the rectified 7 kHz signal. I would try 1 kHz and change it later if necessary. The output of the recitfier is to be connected to an AC voltmeter which will be used to read the distortion. There should be a dc blocking capacitor between the two. I would use a 0.1 μFd capacitor with a 100 kΩ resistor to ground on the meter side to block the dc output of the rectifier from the meter.
IM distortion analyzers are usually used to test audio power amplifiers. We will use a non-inverting op-amp amplifier in the lab. The two types of distortion to be analyzed are clipping distortion and crossover distortion. The basic circuits are shown in the figure below. The diodes should be 1N4148. The resistor values are R1 = 100 kΩ, R2 = 1 kΩ, R3 = 20 kΩ, and R4 = 1 kΩ. These values will give an input resistance of 100 kΩ and a voltage gain of 21. (Audio amplifiers are usually designed to have a voltage gain of 20. About the closest you can get to this with 5% resistors is 21.)
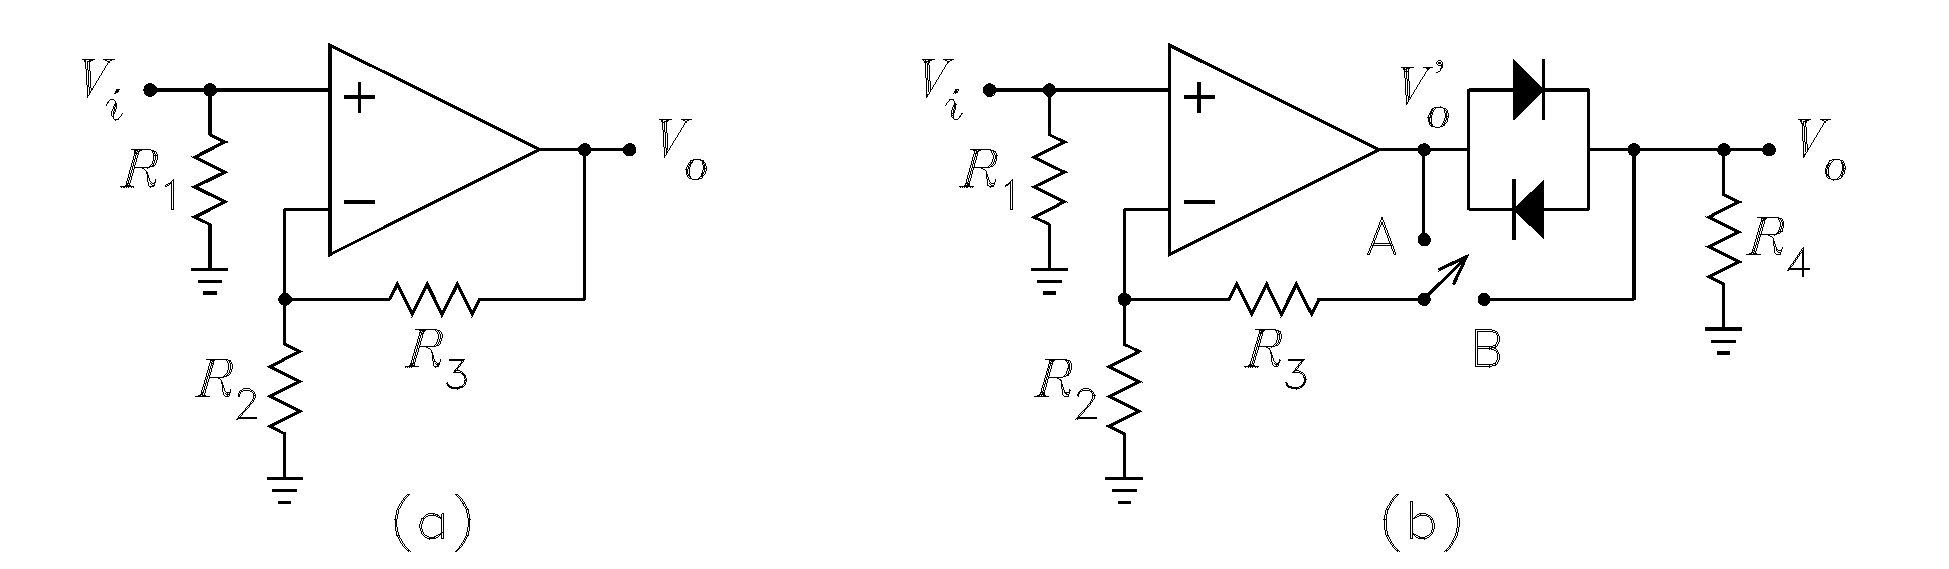
Assemble the amplifier circuit in Fig. (a). Apply a sine wave at 1 kHz and drive the amplifier into mild clipping. Use the FFT analyzer feature of the oscilloscope to look at the harmonics generated by the clipping. These should mainly be at odd harmonics of the signal frequency, i.e. at 3 kHz, 5 kHz, 7 kHz, etc. Reduce the input signal until the clipping just disappears. You should see the harmonics on the FFT analyzer disappear or almost disappear. If everything works, the next step is to use the amplifier with the IM analyzer.
Connect the amplifier to the analyzer as shown in the block diagram above. Adjust the IM signal until the amplifier is driven into mild clipping of the 7 kHz component of the test waveform. It should not clip the 60 Hz component. Use the oscilloscope to look at the waveforms at the various parts of the circuit. The waveform for v3 should show the clipped signal. The waveform for v4 should show the clipped 7 kHz component with the 60 Hz component filtered out. With the low-pass filter capacitor removed, the waveform for v6 should show the full-wave rectified 7 kHz component. Note the envelope modulation on the signal. Now put the low-pass filter capacitor in the circuit. You should only see the envelope with the full-wave rectified harmonics filtered out. You may have to adjust the filter cutoff frequencies if the waveforms are not correct.
Use the two channels of the oscilloscope to display the waveforms for v3 and v6 simultaneously. Document the time shift between the two waveforms. This is due to the phase shifts in the filters.
Use the FFT analyzer to measure the percent distortion on the 7 kHz term in the waveform at v4. The signal level should be such that this distortion is around 5%. Note that the IM distortion components occur below and above the 7 kHz fundamental. Measure the ac voltage at the output of the analyzer. Take the ratio of the % distortion to the rms ac voltage to obtain the calibration factor of the analyzer. When the signal is changed, multiplication of the ac voltmeter reading by this factor should give the % IM distortion.
The final step is to use the analyzer to measure crossover distortion. Modify the non-inverting op-amp amplifier to add the two diodes and R4 as shown in Fig. (b) above. Connect the circuit so that the feedback is taken from point A. Apply the IM test signal to the amplifier and adjust the level so that the crossover distortion is clearly displayed on the oscilloscope. Measure the % distortion for several different levels of the signal. Do not drive the amplifier into clipping.
The final step is to connect the feedback to point B. The crossover distortion will be greatly reduced, but a small amount will still be there. Measure the % distortion for several different levels of the signal. The amplifier should not be driven into clipping.
The final step is to apply a single 1 kHz signal to the amplifier with the diodes. Look at the signals at V'o and Vo with the feedback connected to points A and B. You should be able to explain the differences in these waveforms in your report.